|
|
|||
|---|---|---|---|
Key facts
The Land Degradation Surveillance Framework (LDSF) was developed as a response to a lack of methods for systematic landscape-level assessment of soil and ecosystem health. The methodology is designed to provide a biophysical baseline at landscape level, and a monitoring and evaluation framework for assessing processes of land degradation and the effectiveness of rehabilitation measures (recovery) over time.
LDSF indicators
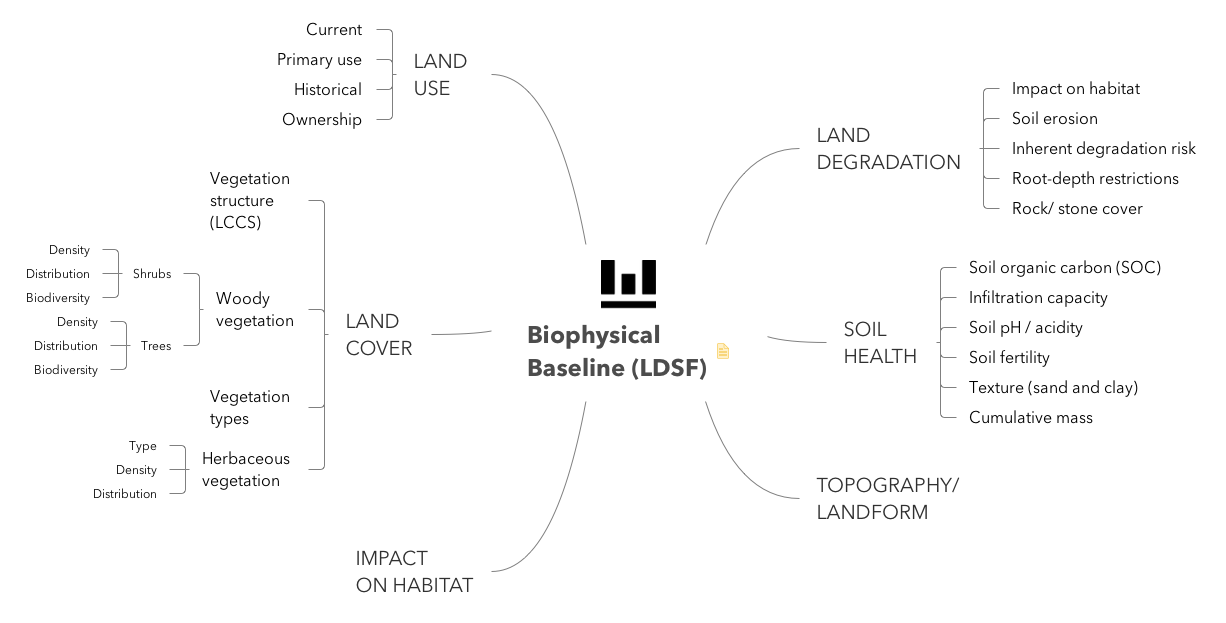
Figure 1: The main indicators measured as part of the LDSF.
For more details DOWNLOAD THE LDSF FIELD GUIDE! (English)
or
Where has the LDSF been employed?
The LDSF has been employed in a number of countries across the global tropics, as shown in the map below:
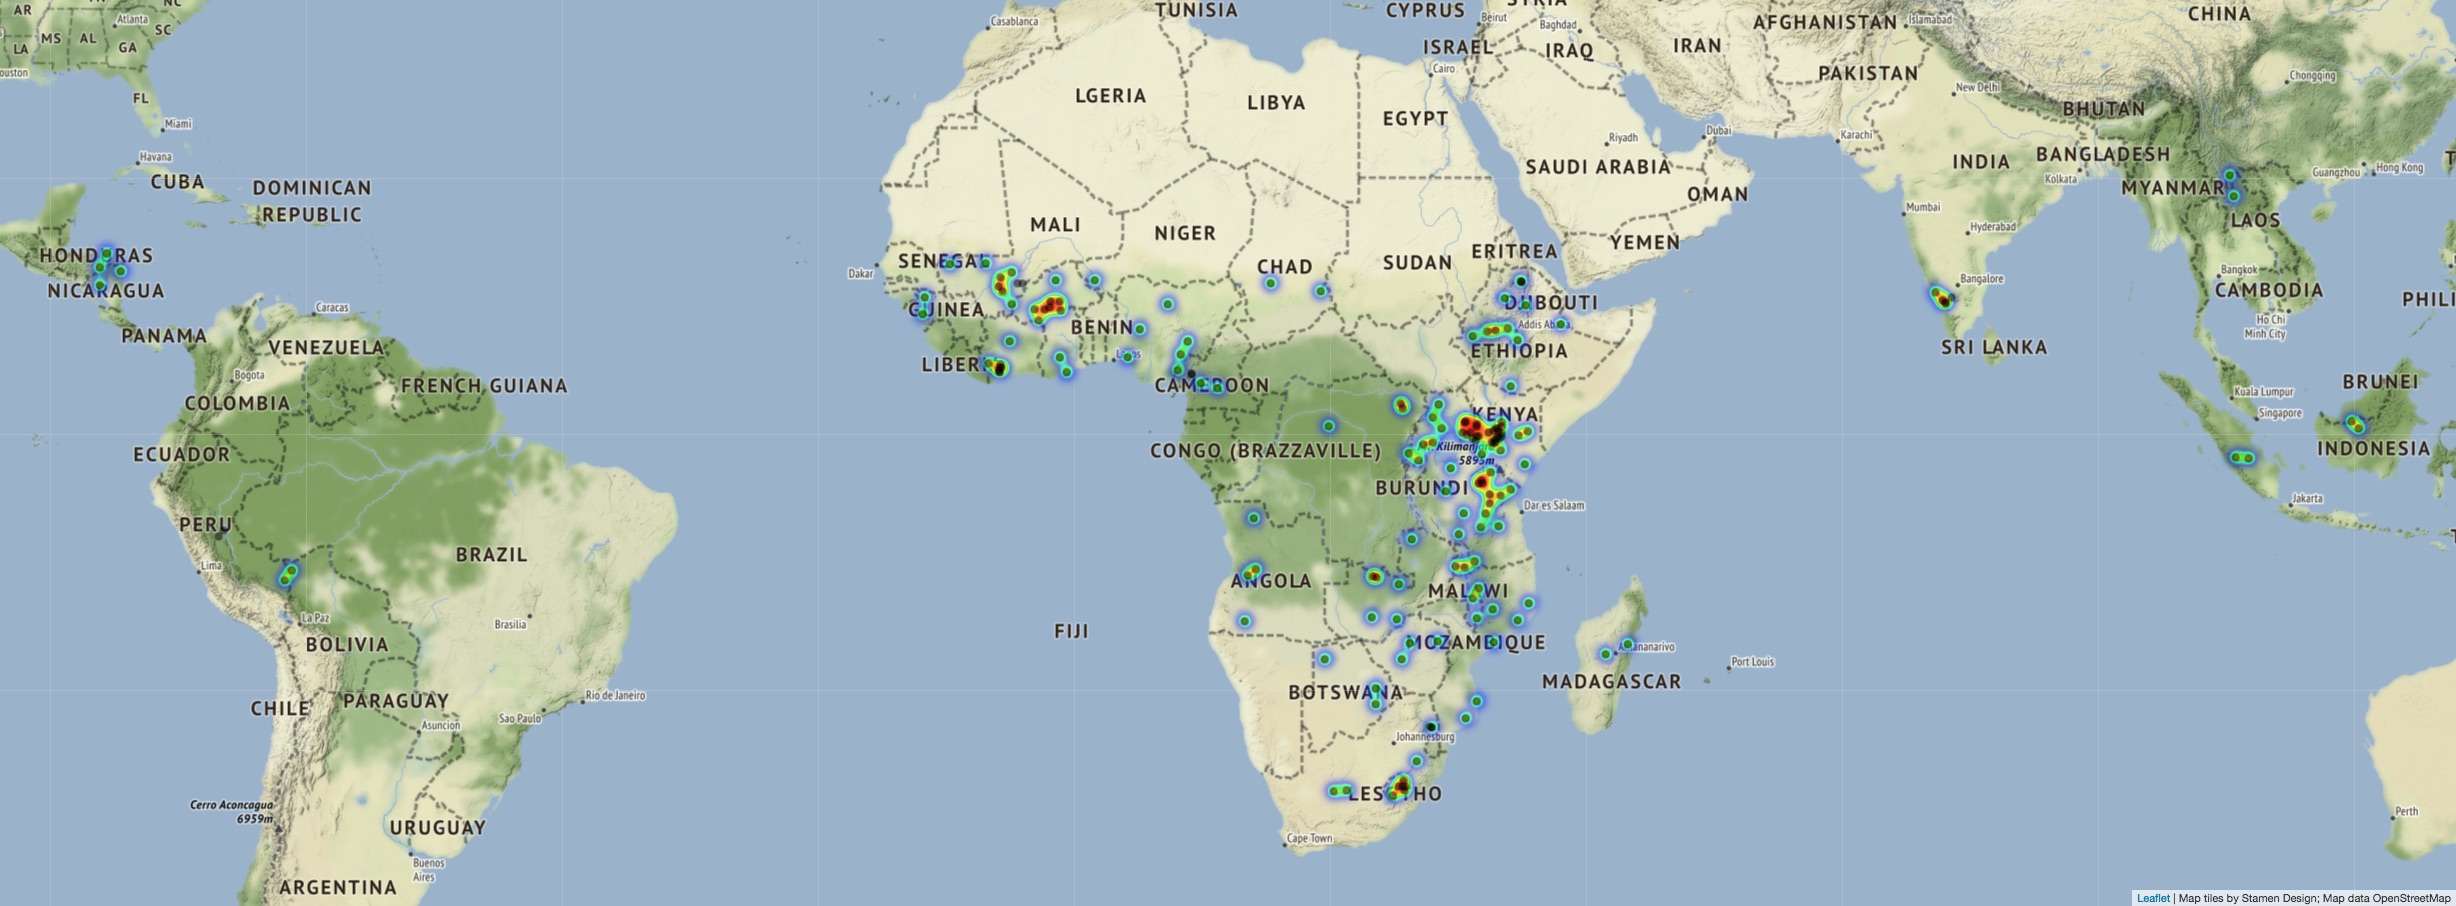
Figure 2: Map showing the locations of LDSF sites (as per early 2018) in the global tropics.
Sampling design
The framework is built around a hierarchical field survey and sampling protocol using sites that are 100 square km (10 x 10 km). **LDSF** sites may be selected at random across a region or watershed, or they may represent areas of planned activities (interventions) or special interest. Within each site, 16 tiles (2.5 x 2.5 km in size) are created and random centroid locations for clusters within each tile are generated. Each cluster consists of 10 plots, with randomized centre-point locations falling within a 1 km2 area. Thus, the **LDSF** has two (or in some cases three) levels of randomization, which minimize local biases that may arise from convenience sampling. Each plot is 0.1 ha and consists of 4 subplots, 0.01 ha in size.
Why use a hierarchical sampling design?
When we assess land health in landscapes using multiple indicators at the same time (e.g. land use, land cover, soil properties, soil erosion, etc) multiple perspectives are needed to understand how these indicators vary at different spatial scales. A nested hierarchical sampling design (Figure 2) is useful in this regard as it allows us to conduct analysis that incorporates scale. This is particularly important in predictive modeling where we need to understand uncertainty (or accuracy) of our models at different scales as well.
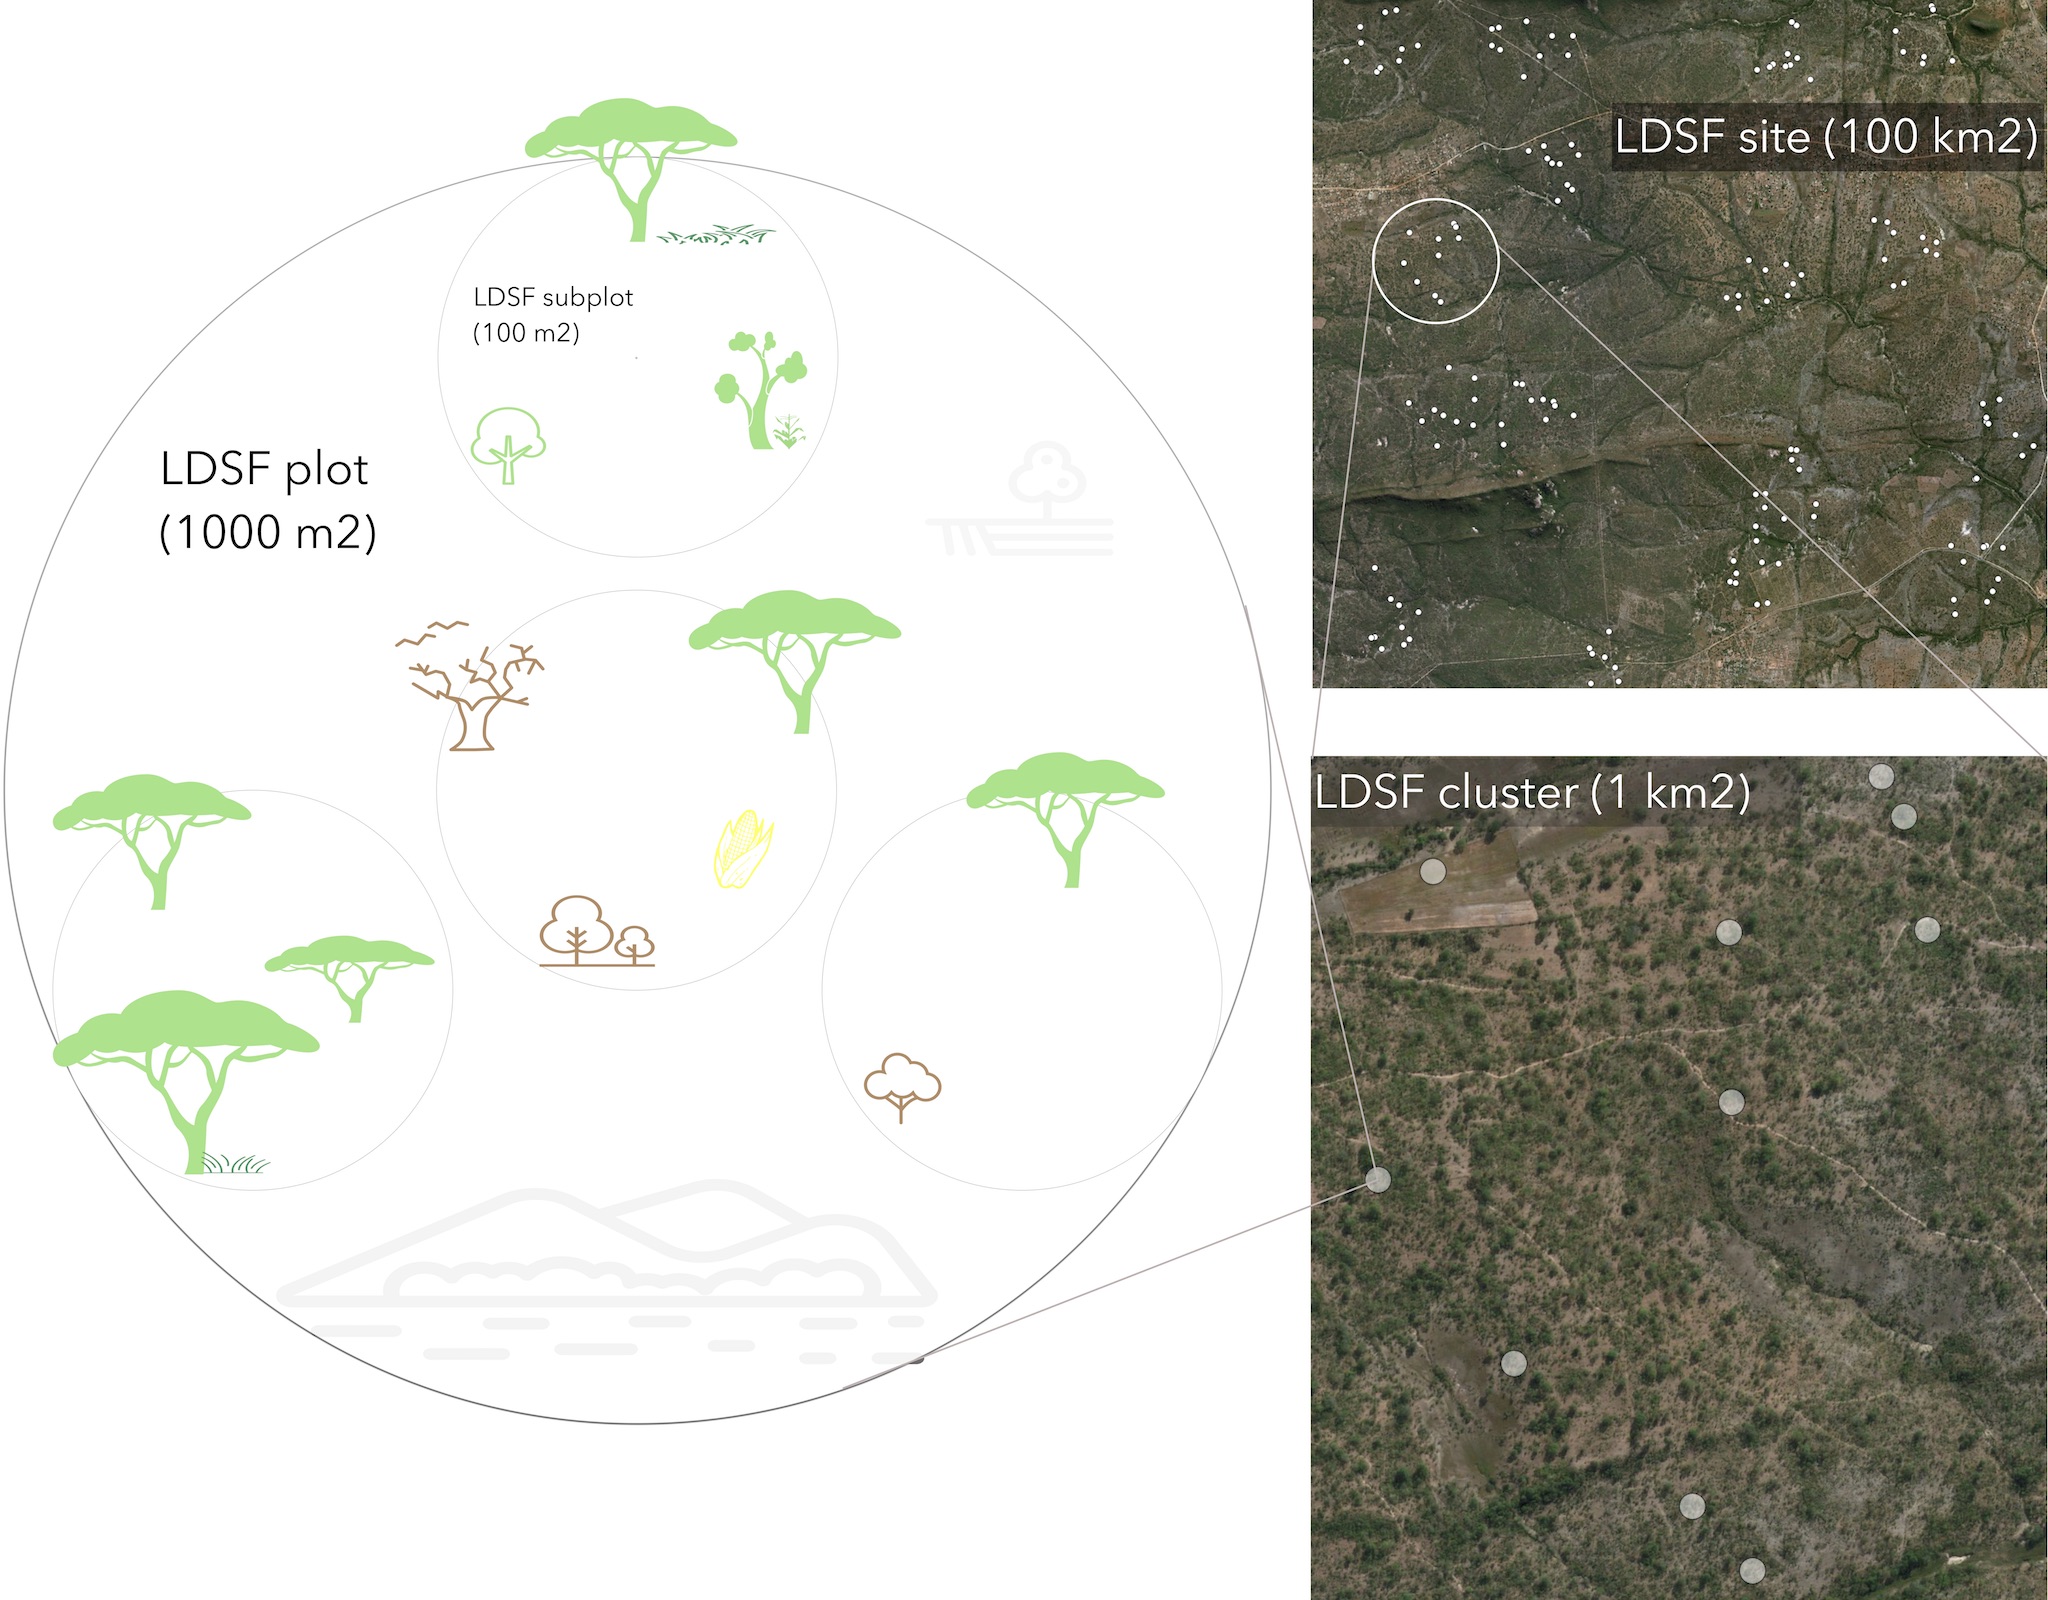
Figure 3: Schematic illustration of a LDSF site (top-right), cluster (bottom-right), and plot and subplots (left). Source: Vågen, T.-G., Winowiecki, L.A., Twine, W., Vaughan, K., 2018. Spatial Gradients of Ecosystem Health Indicators across a Human-Impacted Semiarid Savanna. Journal of Environmental Quality.
Full text is available here!
Data analytics
While the LDSF was designed to collect data on biophysical variables across as range of indicators, as summarized in Figure 1, it forms part of the Ecosystem Health Surveillance System (EcoHSS) developed by the World Agroforestry Centre (ICRAF). In this system, we apply a range of statistical modeling and machine learning methods to assess ecosystem health at multiple spatial scales and across social and ecological systems.
A key aspect of the EcoHSS is the use of open source tools such as R statistics, Python and QGIS to conduct data analyses and to produce spatial assessments of processes of land degradation, soil functional properties, vegetation cover and biodiversity. Models based on earth observation (EO) data from Copernicus and NASA are key in this regard, including sensors such as Sentinels 1 and 2, Landsat and MODIS, to mention some.
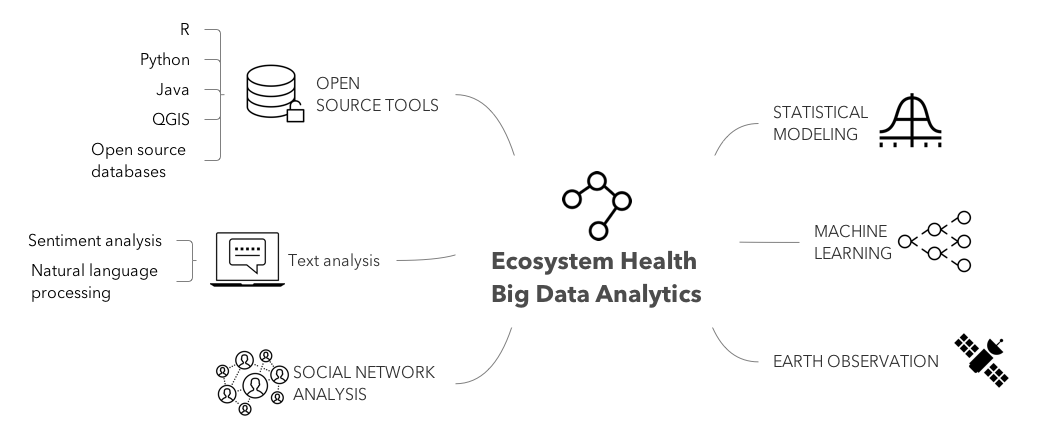
Figure 4: A range of different analytical tools and approaches are used as part of the LDSF, including highly specialized use of earth observation data.
Diagnostics
Mapping outputs are produced at multiple spatial scales, with fine-resolution maps produced at 5 to 10 m or higher resolution, high resolution maps at 20 to 30 m and moderate resolution maps at 250 to 500 m resolution. Our vision is to apply such spatial assessments and maps in real decision contexts, particularly relating to identifying and tracking processes of land degradation in a spatially explicit way, and to identifying options for land restoration that are both spatially and thematically targeted. This requires a rigorous indicator framework, systematic field and lab data collection and analysis methods and rigorous data analytics. Only then can we start providing meaningful diagnostics to unpack the complexity involved in managing ecosystem health across landscapes, including trade-offs.
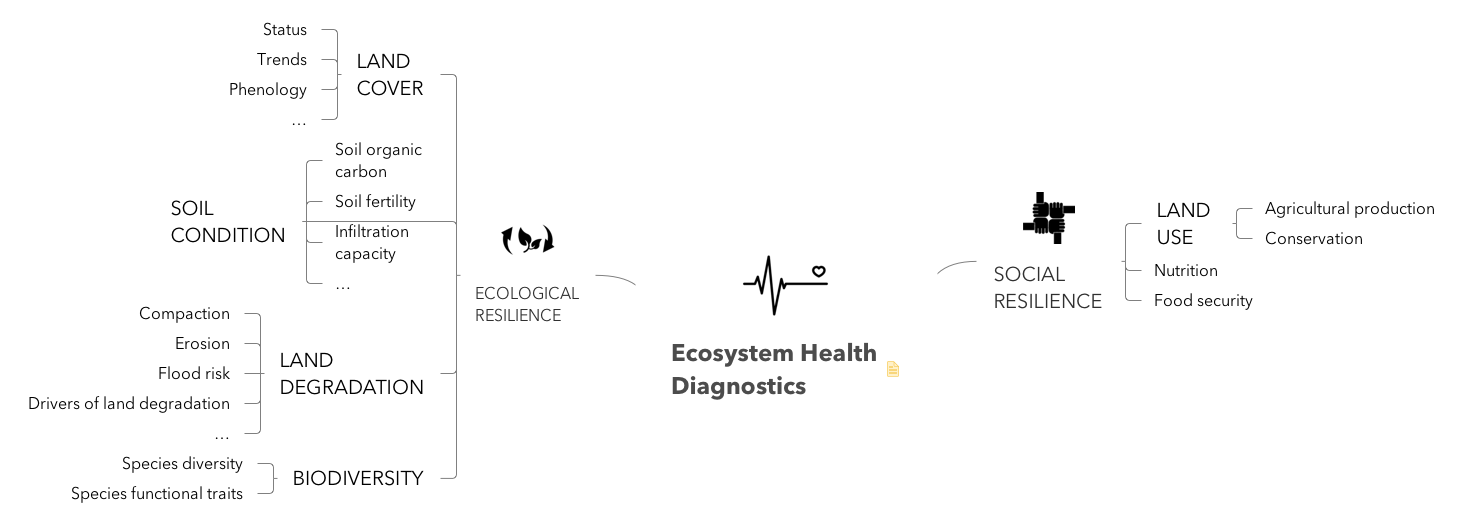
Figure 5: A range of different analytical tools and approaches are used as part of the LDSF, including highly specialized use of earth observation data.
Data management
Field and laboratory data collected using the LDSF are stored in open source databases (principally MySQL and PostgreSQL), hosted at the World Agroforestry Centre (ICRAF).
Get in touch for more details!
Selected publications where the LDSF has been applied
Vågen, T.-G., Winowiecki, L.A., Tondoh, J.E., Desta, L.T., Gumbricht, T., 2016. Mapping of soil properties and land degradation risk in Africa using MODIS reflectance. Geoderma 263, 216–225. doi:10.1016/j.geoderma.2015.06.023
Winowiecki, L., Vågen, T.-G., Massawe, B., Jelinski, N.A., Lyamchai, C., Sayula, G., Msoka, E., 2016. Landscape-scale variability of soil health indicators: effects of cultivation on soil organic carbon in the Usambara Mountains of Tanzania. Nutr. Cycl. Agroecosystems 105, 263–274. doi:10.1007/s10705-015-9750-1
Minasny, B., Malone, B.P., McBratney, A.B., Angers, D.A., Arrouays, D., Chambers, A., Chaplot, V., Chen, Z.-S., Cheng, K., Das, B.S., Field, D.J., Gimona, A., Hedley, C.B., Hong, S.Y., Mandal, B., Marchant, B.P., Martin, M., McConkey, B.G., Mulder, V.L., O’Rourke, S., Richer-de-Forges, A.C., Odeh, I., Padarian, J., Paustian, K., Pan, G., Poggio, L., Savin, I., Stolbovoy, V., Stockmann, U., Sulaeman, Y., Tsui, C.-C., Vågen, T.-G., van Wesemael, B., Winowiecki, L., 2017. Soil carbon 4 per mille. Geoderma 292, 59–86. doi:10.1016/j.geoderma.2017.01.002
Vågen, T.-G., Winowiecki, L.A., Abegaz, A., Hadgu, K.M., 2013. Landsat-based approaches for mapping of land degradation prevalence and soil functional properties in Ethiopia. Remote Sens. Environ. 134, 266–275. doi:10.1016/j.rse.2013.03.006
Vågen, T., Robiglio, V., Lohbeck, M., Okia, C., Kindt, R., Opiyo, E., Cornelius, J., 2015. THE POTENTIAL FOR FOREST LANDSCAPE RESTORATION IN DEGRADED FARMLANDS - Filling knowledge gaps on the restoration of degraded smallholder landscape mosaics. Nairobi, Kenya.
Vågen, T.-G., Winowiecki, L.A., 2013. Mapping of soil organic carbon stocks for spatially explicit assessments of climate change mitigation potential. Environ. Res. Lett. 8, 15011. doi:10.1088/1748-9326/8/1/015011
Vågen, T.-G., 2015. Methods for Assessing the Impacts of IFAD ASAP-supported Projects on Land and Ecosystem Degradation. Nairobi, Kenya.
Kearney, S.P., Coops, N.C., Chan, K.M.A., Fonte, S.J., Siles, P., Smukler, S.M., 2017. Predicting carbon benefits from climate-smart agriculture: High-resolution carbon mapping and uncertainty assessment in El Salvador. J. Environ. Manage. 202, 287–298. doi:10.1016/j.jenvman.2017.07.039
Takoutsing, B., Martín, J.A.R., Weber, J.C., Shepherd, K., Sila, A., Tondoh, J., 2017. Landscape approach to assess key soil functional properties in the highlands of Cameroon: Repercussions of spatial relationships for land management interventions. J. Geochemical Explor. 178, 35–44. doi:10.1016/j.gexplo.2017.03.014
Lohbeck, M., Winowiecki, L., Aynekulu, E., Okia, C., Vågen, T.-G., 2018. Trait-based approaches for guiding the restoration of degraded agricultural landscapes in East Africa. J. Appl. Ecol. 55, 59–68. doi:10.1111/1365-2664.13017
Massawe, B.H.J., Winowiecki, L., Meliyo, J.L., Mbogoni, J.D.J., Msanya, B., Kimaro, D., Deckers, J., Gulinck, H., Lyamchai, C., Sayula, G., Msoka, E., Gunnar-Vagen, T., Brush, G., Jelinski, N.A., 2017. Assessing drivers of soil properties and classification in the West Usambara mountains, Tanzania. Geoderma Reg. 11, 141–154. doi:10.1016/j.geodrs.2017.10.002
Abegaz, A., Winowiecki, L.A., Vågen, T.-G., Langan, S., Smith, J.U., 2016. Spatial and temporal dynamics of soil organic carbon in landscapes of the upper Blue Nile Basin of the Ethiopian Highlands. Agric. Ecosyst. Environ. 218, 190–208. doi:10.1016/j.agee.2015.11.019
Winowiecki, L.A., Vågen, T.-G., Boeckx, P., Dungait, J.A.J., 2017. Landscape-scale assessments of stable carbon isotopes in soil under diverse vegetation classes in East Africa: application of near-infrared spectroscopy. Plant Soil 1–14. doi:10.1007/s11104-017-3418-3
Vågen, T.-G., Walsh, M.G., 2012. Sentinel Site Surveillance in Segou Region, Mali: An evidence-based approach to assessing land degradation and targeting sustainable land management interventions, in: Land Health Surveillance - an Evidence-Based Approach to Land Ecosystem Management. United Nations Environment Programme (UNEP), pp. 115–171.
Winowiecki, L., Vågen, T.-G., Huising, J., 2016. Effects of land cover on ecosystem services in Tanzania: A spatial assessment of soil organic carbon. Geoderma 263, 274–283. doi:10.1016/j.geoderma.2015.03.010
Tondoh, J.E., Ouédraogo, I., Bayala, J., Tamene, L., Sila, A., Vågen, T.-G., Kalinganiré, A., 2016. Soil organic carbon stocks in semi-arid
West African drylands: implications for climate change adaptation and mitigation. SOIL Discuss. 1–41. doi:10.5194/soil-2016-45
Short video from the CGIAR Climate Change and Food Security (CCAFS) research program highlighting the LDSF:

Comments
No comments yet.